
Geographic Information System Program
Summary:
The addition of the Geographic Information System Program (GIS) Program at CMMCP has given the project many new tools for creating a more productive, efficient mosquito control program. In time, the GIS will encompass essentially all aspects and services of CMMCP, helping in the collaboration of various departments.
Service request (adulticiding) map:
This map shows the town of Northborough and surrounding area; the open service requests are in red and closed service requests are in gray/green. Residents submit a service request online (showing up a "open", or red in color) and once technicians service the request our office closes out the request and it turns gray/green in the program. If the resident also submits an email address, they receive notification about the upcoming service as well as a notification after the application has been performed. If we need to cancel or reschedule the service a separate email is sent out to the resident.
ULV adulticiding treatment map:
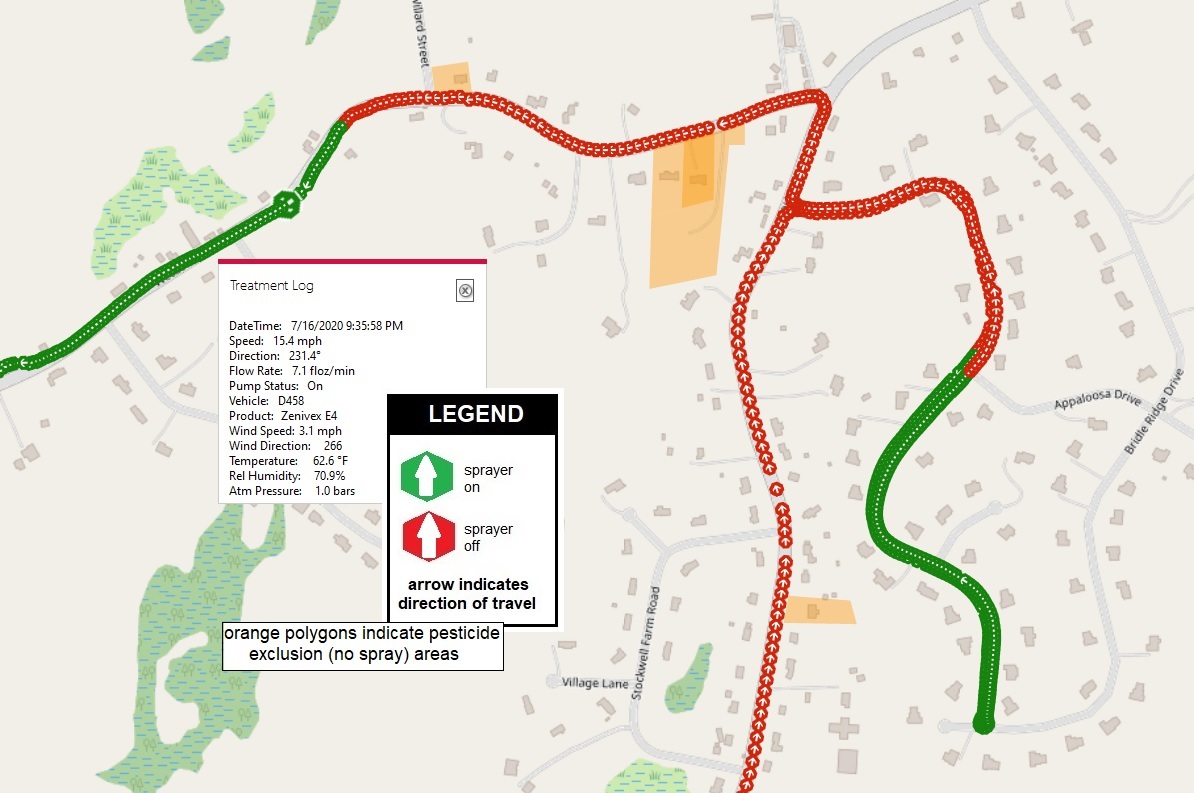
This is a map of an area that adulticiding (spraying) has been performed. When residents call to see if an application has been performed in their area, we can easily check the system to see if/when it has been done. This system also outlines any exclusion (no spray) areas and alerts the technician as they approach the area. Weather information is also available in this system under the "treatment log".
Helicopter tracks for aerial larval control:
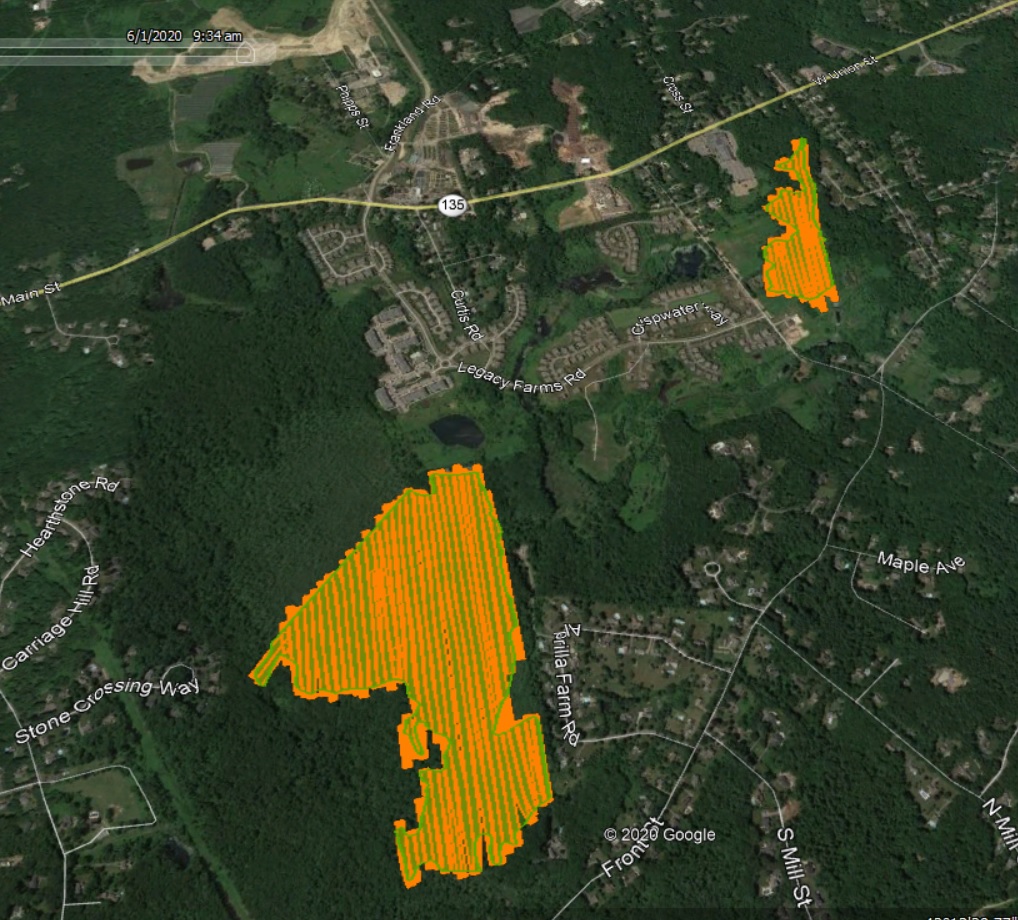
Orange areas are targeted wetlands for treatment; green lines are the actual helicopter tracks. Adding in the estimated 100 foot application swath, these wetlands received good coverage.
Catch basin treatment map:
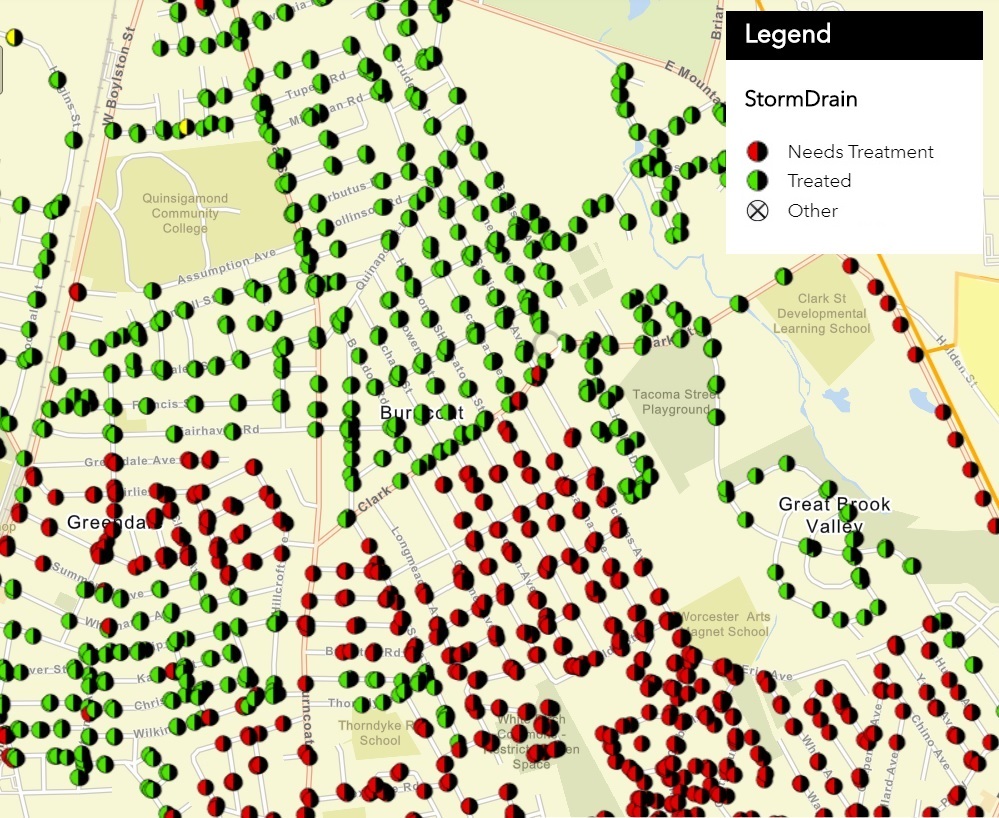
This map shows our catch basin treatments in the city of Worcester. Green/black dots indicate basins that were recently treated and receiving active control, the red/black dots show basins that need to be treated again. In the system we indicate the appropriate treatment length of time of the pesticide used and the system automatically changes the color of the dots to let us know retreatment may be necessary.
Water management site plan:
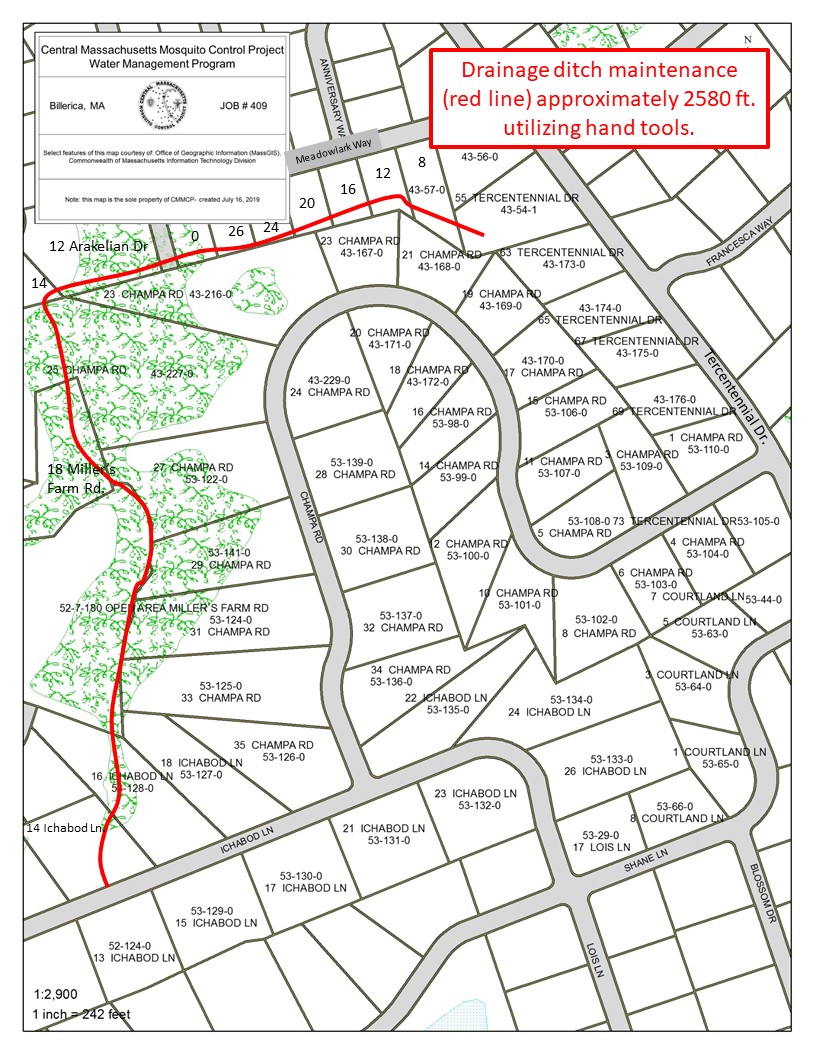
Our GIS program is also beneficial in our water management program, allowing field crews to see property boundaries, ditch location and other important features.
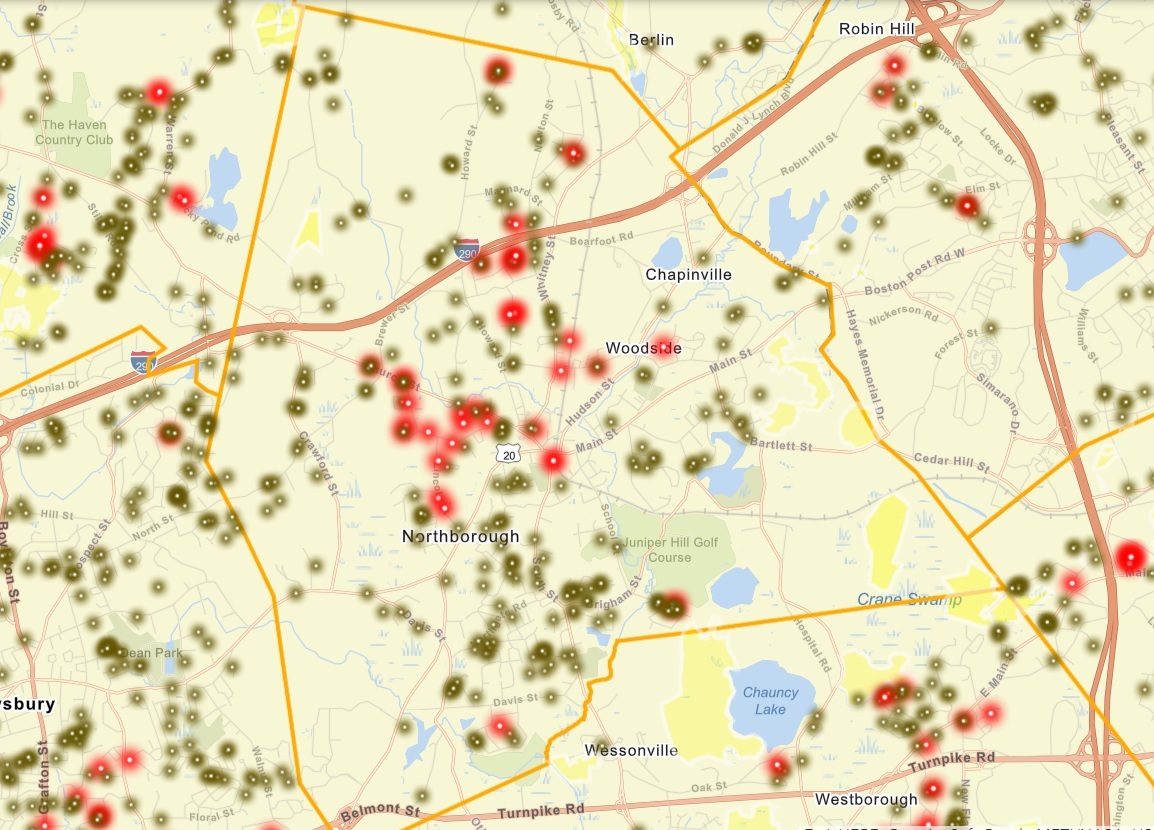
Targeted Larval Control:
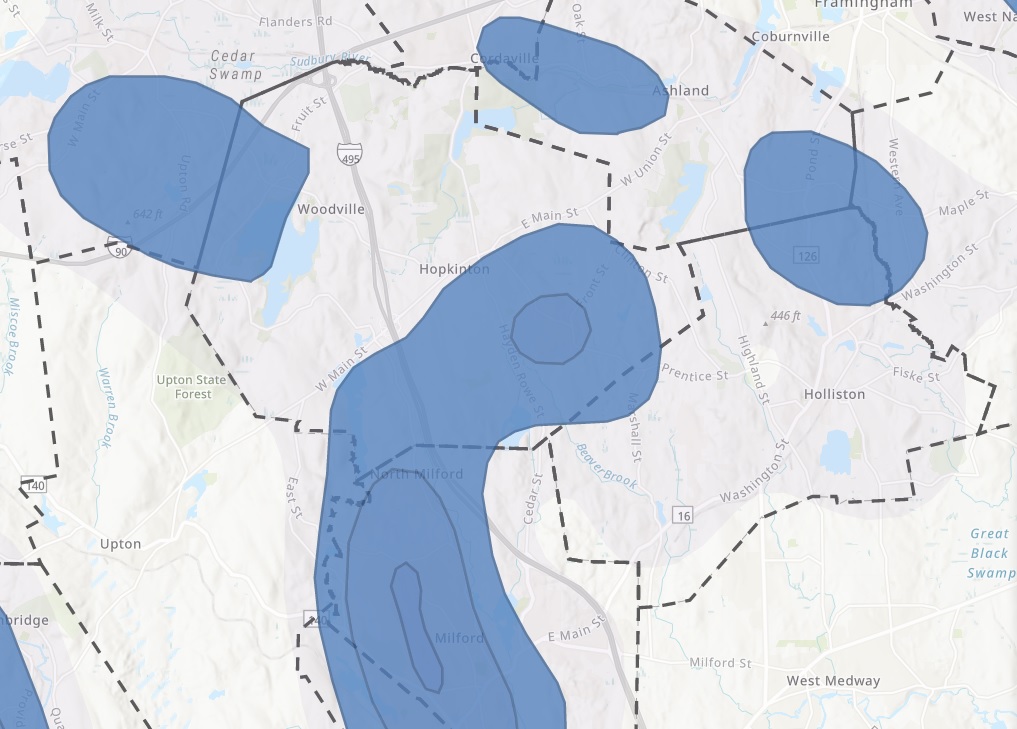
The map above is a GIS "heat map" (heat mapping is a way of geographically visualizing locations so that patterns of higher than average occurrence of something can be visually demonstrated) showing adulticide (spray) requests from May - June, indicating areas of high populations of spring brood mosquitoes. Using this data, we can then target the wetlands in the area outlined for larval control the next season.
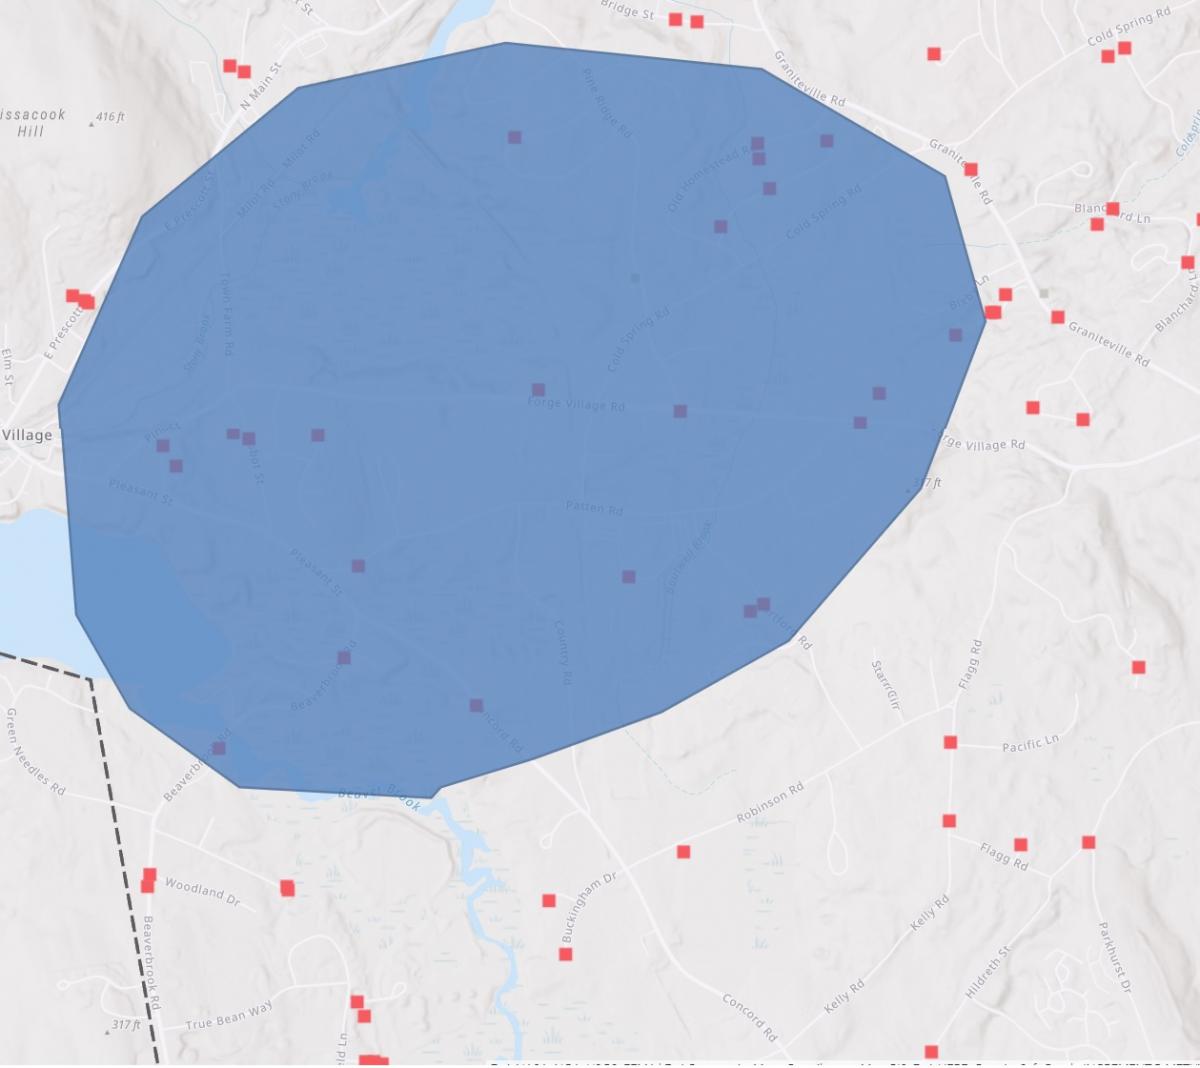
This map is a zoomed in area of our heat mapping. The red squares indicate larval mosquito habitat we have databased, and those areas circled in blue would be the first areas designated for monitoring and treatment if necessary. From that point the technicians would spread out and field check additional larval habitats.
The heat maps are generated from a combination of the following data:
- Previous year's service requests,
- Larval habitats we have in our system, and
- The approximate flight range of the mosquito species most prevalent in May & June
Asset Management:
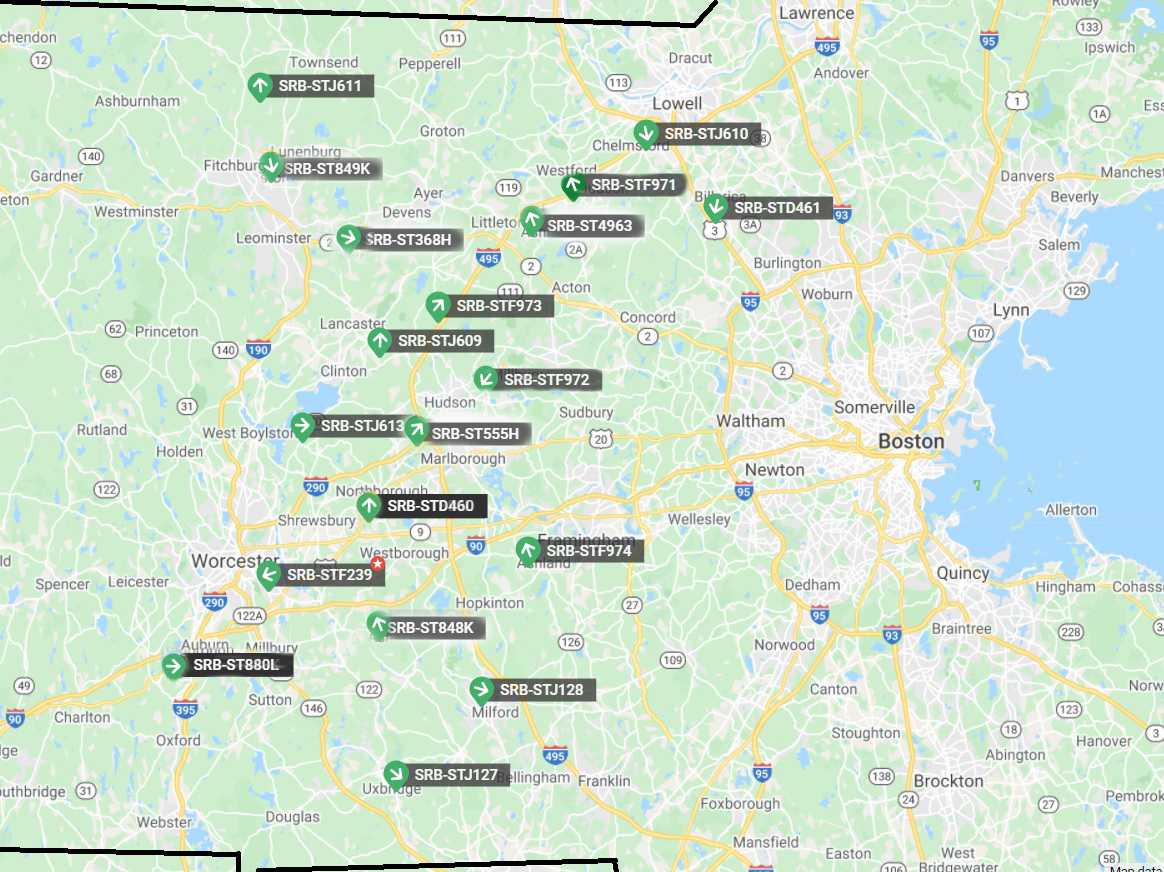
GPS tracking allows administrative personnel to deploy staff and equipment efficiently.
Staff Contacts
| Name | Phone |
|---|---|
| Frank H. Cornine III, MPH | (508) 393-3055 |